Electoral Campaigns and News Polarization by Luis Menéndez
A growing body of research has been warning that social division is reaching unprecedented levels both in the United States and in Europe. For example, the Edelman Trust Barometer placed Spain among the five most polarized countries in the world in 2023.
Studies such as those by Martin and Yurukoglu or Boxell, Gentzkow and Shapiro, point to the consumption of traditional media as one of the main factors behind this trend. In response to these concerns, efforts to monitor and regulate the political content being offered have grown substantially, especially during electoral periods. Even so, we still know relatively little about the effects of campaigns on the way information is presented and consumed.
In my paper, I address this question. I study the impact of electoral campaigns on Spain’s information market and the effect of existing regulation, whose goal is to guarantee informational pluralism. My results show that audiences polarize their demand for political information after the start of the electoral campaign. In this context, applying measures such as the proportional airtime rule across parties can end up producing an even more polarized scenario.
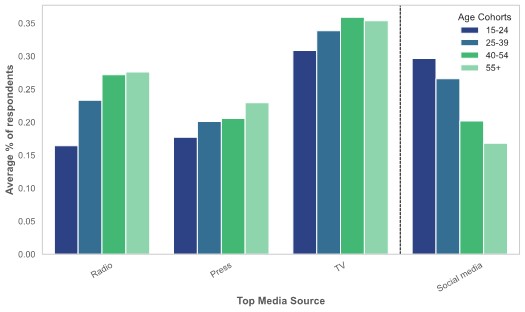
Despite the popularity of social media, television continues to play a central role in access to political information. This is illustrated by the following chart, built using Eurobarometer 2022 data, which reports the average responses to the question “What is your preferred medium for obtaining political information?” across all EU countries. Television is the preferred medium in every age group, even ahead of social networks.
To study the news market, I developed an algorithm that monitors, on a daily basis, the newscasts of the main national broadcasters—La Sexta, TVE, T5, and A3. Over the period analyzed in this project—between December 2022 and July 2023—I processed more than 500 hours of video and analyze their transcripts using Machine Learning techniques and Large Language Models (LLMs), which allows me to construct a new index of political bias.
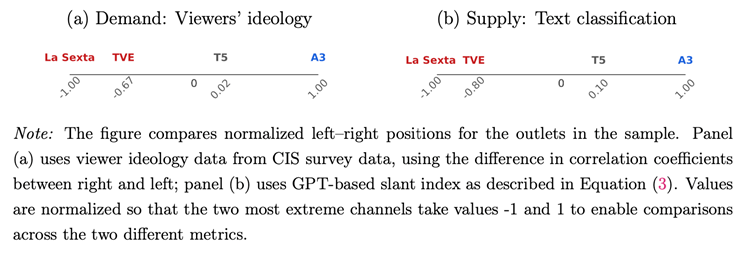
The figure above shows the ideological score of the outlets in the left-right dimension after the ChatGPT classification (right panel) and, analogously, their score according to survey data using the distribution of the ideology of their viewers. Importantly, the LLM-based measure yields a consistent ranking: the content offered by the outlets matches the distribution of their viewers—something that other classification metrics cannot reveal. This is crucial, as it enables me to identify key variation in product characteristics that allows me to fit a discrete-choice model of product differentiation. For more details on the classification and results, I invite the reader to consult our Spanish Media Monitor project, where we compile and update these data and provide interactive tools to compare political coverage across channels, track the evolution of bias over time, and see which events generate the greatest agreement or disagreement between broadcasters.
On the other side of the market—the demand side—I use television consumption data from audience meters. Combined with information on the political bias of news content, this allows me to compute how many viewers are exposed to each type of content.
One of the main contributions of my work is to identify supply and demand separately, something that until now has been hindered by the lack of exogenous variation on both sides of the market. Channels adjust their bias taking into account the preferences of their audiences, and at the same time audiences choose their preferred channel as a function of that content. Content is therefore endogenous.
News Demand
To identify demand, I use supply shocks. Specifically, I exploit the fact that TV channels (and traditional media more generally) contract with newswire agencies to obtain information about the day’s events and then decide their coverage based on that material. To capture this process, I collect more than 32,000 stories from the main newswire agency that serves the outlets in my sample and classify them by tone and by the party they refer to, applying the same methodology. In this way, I construct the daily landscape of available political information, which allows me to estimate how channels adjust their coverage in response to exogenous changes in political news. The figure below illustrates how the amount of coverage time on each channel (y-axis) changes when there is greater availability of positive or negative news about a particular party (x-axis).
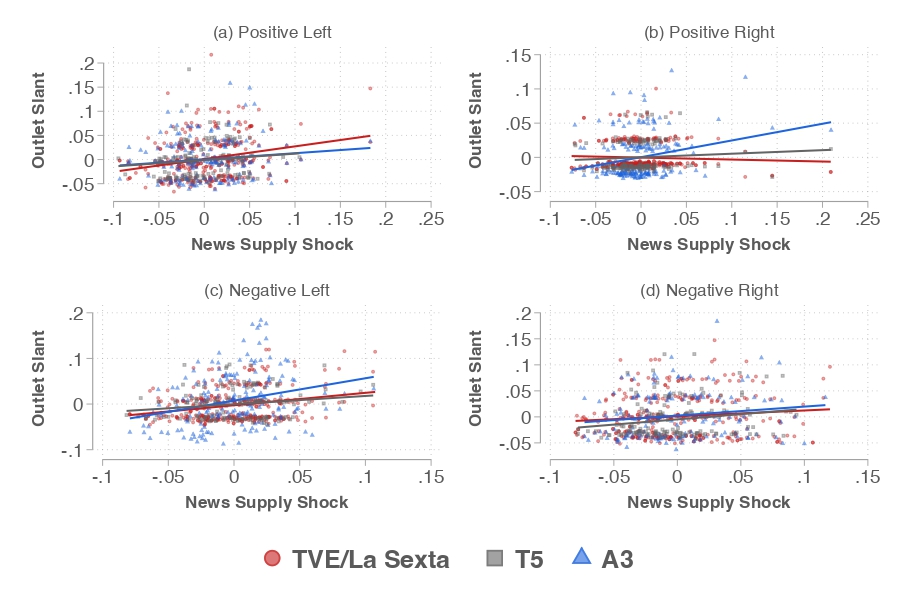
How do channels react to these shifts in the news environment? First, the slopes are mostly positive: channels do not ignore events, and when there is more news about a party they devote more time to it. Second, adjustment is asymmetric: the additional coverage time is larger when the content favors the bloc aligned with the channel. For instance, when the share of positive stories about the right increases by one standard deviation, the right-wing outlet A3 raises its favorable-to-the-right time by 0.24 standard deviations, while left-leaning channels (TVE and La Sexta) barely react. By contrast, responses to an increase in negative content about the right are not significant: channels already devote substantial coverage to negative news about that bloc, leaving little room to increase that type of content even further. These differences in how channels can adjust their coverage depending on the composition of the day’s information landscape are what allow me to identify viewers’ preferences for content.
I incorporate these measures into a structural model. On the demand side, I estimate a discrete-choice model in which viewers choose their preferred channel as a function of the political bias present in its news. Preferences for political content vary with the viewer’s ideology (whether they are right- or left-leaning), which makes it possible to evaluate the degree of polarization in the demand for information. To study the effect of the electoral campaign, I estimate the model in two periods: before and during the campaign for Spain’s 2023 general election.
The results show that viewers’ preferences change substantially between the two periods. Once the campaign begins, the demand for information becomes even more polarized. The figure below illustrates this by showing the demand elasticity for each type of content in left-leaning regions (left panel) and right-leaning ones (right panel).
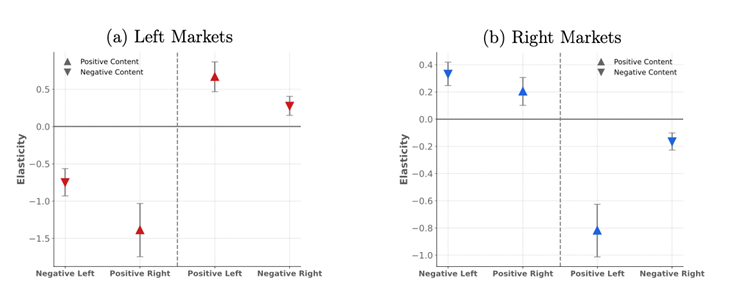
Viewers demand positive content about their own party and penalize content favorable to the opposing bloc. This latter effect—aversion toward the outgroup—is the dominant force, consistent with the phenomenon of affective polarization, where rejection of the adversary matters more than support for one’s own group.
News Supply
Once demand is characterized, I move on to the supply side. In practice, editorial teams review the daily audience numbers and the day’s events before deciding their coverage. To capture this, I develop a model in which channels choose the amount of time and the tone devoted to each party and compete to maximize expected audience. The costs of producing bias depend on the day’s availability of news, as well as on unobservable factors such as private interests.
To identify costs, I use variation between midday and evening newscasts. Because the two editions are separated by only a few hours, differences in evening content are driven primarily by the arrival of unexpected news during the afternoon. This allows me to use within-day variation to control for unobservable factors and identify costs.
Estimated costs reveal that channels are quite specialized in producing political content. For instance, making coverage on the right 1 p.p. more negative entails an audience share loss of 1 p.p. for the right-wing outlet, compared with only 0.5 p.p. for the left-leaning outlets. This corresponds to about 6% (3%) of the drop observed when a major football match overlaps the newscast.
The Unintended Consequences of the Proportional Airtime Rule
Finally, I use the estimated model as a policy laboratory to evaluate the proportional airtime rule, which requires that the time devoted to each party be proportional to its vote share. Countries such as France and Italy apply and monitor this rule but there is no existing evidence of its effects.
The counterfactual exercise shows that this rule generates unintended effects. To comply, channels adjust along two margins: the total amount of political content and the tone within those minutes. The latter margin is crucial, because regulation controls only time, not whether coverage is positive or negative. With a polarized audience, the most profitable tone is negative toward the opposing party. As a result, the new equilibrium after applying the rule displays an ideological dispersion in the content offered that is three times larger.
In conclusion, because the main measures used for media monitoring ignore tone—and regulation is built on those measures—unexpected effects can arise. So what should we do? The results above suggest that channels respond to an audience that is already polarized. In this context, regulating only the supply of information can create distortions and may also push part of the public toward other platforms such as X or Facebook, which have proven to be focal points of polarization and hate speech. A complementary approach is to act on demand: provide users with better information so they can review which sources they follow and improve the quality of the news they consume. I leave the question open for debate.
About the Author
Luis Menéndez is a Ph.D. candidate at Universitat Autònoma de Barcelona, the Barcelona School of Economics, and the IDEA Graduate Program
His research interests are in Political Economics and Media Economics. To learn more about his research, visit: https://luisignaciomenendez.github.io
Social Media Handles: